


Page 71 - rapport ommp2018
P. 71
Granule of Marbel:
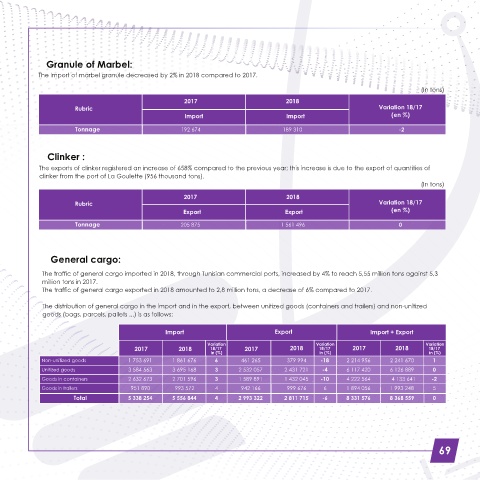
            The Import of marbel granule decreased by 2% in 2018 compared to 2017.

                                                                                                                             (In tons)
                                                       2017                          2018
                       Rubric                                                                                    Variation 18/17
                                                        Import                        Import                         (en %)
                       Tonnage                        192 674                       189 310                            -2


               Clinker :
             The exports of clinker registered an increase of 658% compared to the previous year; this increase is due to the export of quantities of
             clinker from the port of La Goulette (956 thousand tons).
                                                                                                                             (In tons)
                                                       2017                           2018
                       Rubric                                                                                    Variation 18/17
                                                       Export                        Export                          (en %)
                       Tonnage                        205 875                       1 561 496                          0


                General cargo:

             The traffic of general cargo imported in 2018, through Tunisian commercial ports, increased by 4% to reach 5,55 million tons against 5,3
             million tons in 2017.
             The traffic of general cargo exported in 2018 amounted to 2,8 million tons, a decrease of 6% compared to 2017.

              The distribution of general cargo in the import and in the export, between unitized goods (containers and trailers) and non-unitized
              goods (bags, parcels, pallets ...) is as follows:

                                                  Import                          Export                      Import + Export
                                                              Variation                       Variation                        Variation
                                         2017         2018     18/17     2017          2018    18/17     2017         2018      18/17
                                                               in (%)                          in (%)                           in (%)
             Non-unitized goods        1 753 691    1 861 676   6       461 265       379 994   -18    2 214 956    2 241 670    1
             Unitized goods            3 584 563    3 695 168   3      2 532 057     2 431 721  -4     6 117 420    6 126 889    0
             Goods in containers       2 632 673    2 701 596   3      1 589 891     1 432 045  -10    4 222 564     4 133 641  -2
             Goods in trailers          951 890      993 572    4       942 166       999 676    6     1 894 056    1 993 248    5
                       Total           5 338 254    5 556 844   4      2 993 322     2 811 715  -6     8 331 576    8 368 559    0


                                                                                                                                   69

