


Page 67 - rapport ommp2018
P. 67
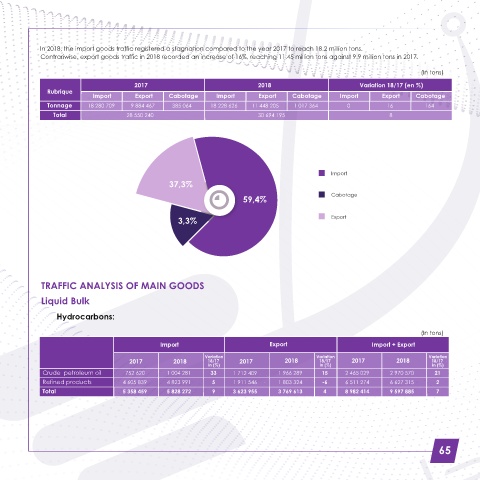
In 2018, the import goods traffic registered a stagnation compared to the year 2017 to reach 18.2 million tons.
             Contrariwise, export goods traffic in 2018 recorded an increase of 16%, reaching 11.45 million tons against 9.9 million tons in 2017.

                                                                                                                             (In tons)
                                         2017                                2018                          Variation 18/17 (en %)
               Rubrique
                            Import       Export    Cabotage      Import      Export    Cabotage      Import       Export    Cabotage
               Tonnage     18 280 709   9 884 467   385 064    18 228 626  11 448 205   1 017 364       0          16          164
                 Total                28 550 240                             30 694 195                             8


                                                                                                   Import
                                                   37,3%

                                                                                                   Cabotage
                                                                         59,4%

                                                      3,3%                                         Export


             TRAFFIC ANALYSIS OF MAIN GOODS

             Liquid Bulk

                   Hydrocarbons:

                                                                                                                             (In tons)
                                                Import                           Export                        Import + Export

                                                              Variation                       Variation                         Variation
                                       2017         2018      18/17     2017         2018      18/17     2017         2018      18/17
                                                               in (%)                          in (%)                            in (%)
              Crude  petroleum oil    752 620     1 004 281    33     1 712 409    1 966 289    15     2 465 029    2 970 570    21
              Refined products       4 605 839    4 823 991     5     1 911 546    1 803 324    -6     6 511 274    6 627 315     2
              Total                  5 358 459    5 828 272     9     3 623 955    3 769 613     4     8 982 414    9 597 885     7


                                                                                                                                   65

