


Page 73 - rapport ommp2018
P. 73
CONTAINERS AND TRAILERS TRAFFIC


             The global traffic of general cargo, transiting through the Tunisian ports, reached 8.38 million tons in 2018, whose 4,1 million tons were
             handled in containers and 2 million tons were handled in trailers.

             Container Traffic :

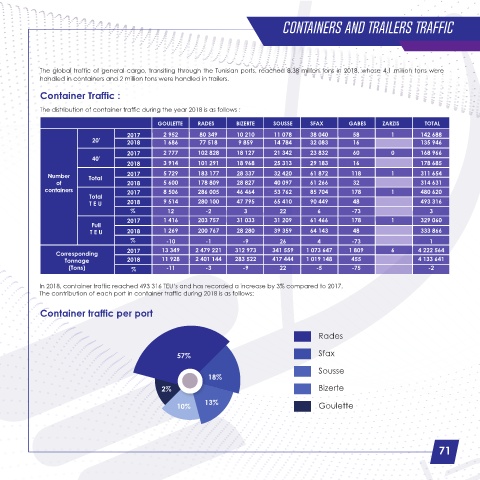
             The distribution of container traffic during the year 2018 is as follows :
                                                GOULETTE   RADES       BIZERTE    SOUSSE     SFAX       GABES     ZARZIS      TOTAL
                                       2017      2 952      80 349     10 210     11 078     38 040      58          1       142 688
                            20'        2018      1 686      77 518     9 859      14 784     32 083      16                  135 946

                                       2017      2 777     102 828     18 127     21 342     23 832      60          0       168 966
                            40'
                                       2018      3 914     101 291     18 968     25 313     29 183      16                  178 685
               Number      Total       2017      5 729     183 177     28 337     32 420     61 872      118         1       311 654
                  of                   2018      5 600     178 809     28 827     40 097     61 266      32                  314 631
              containers               2017      8 506     286 005     46 464     53 762     85 704      178         1       480 620
                           Total
                           T E U       2018      9 514     280 100     47 795     65 410     90 449      48                  493 316
                                        %         12          -2         3          22         6         -73                    3
                                       2017      1 416     203 757     31 033     31 209     61 466      178         1       329 060
                            Full
                            T E U      2018      1 269     200 767     28 280     39 359     64 143      48                  333 866
                                        %         -10         -1         -9         26         4         -73                    1
                                       2017      13 349    2 479 221  312 973    341 559   1 073 647    1 809        6      4 222 564
                  Corresponding
                    Tonnage            2018      11 928    2 401 144  283 522    417 444   1 019 148     455                4 133 641
                     (Tons)             %         -11         -3         -9         22        -5         -75                   -2

             In 2018, container traffic reached 493 316 TEU’s and has recorded a increase by 3% compared to 2017.
             The contribution of each port in container traffic during 2018 is as follows:

             Container traffic per port


                                                                                               Rades


                                                     57%                                       Sfax

                                                                                               Sousse
                                                               18%
                                                 2%                                            Bizerte

                                                             13%
                                                     10%                                       Goulette


                                                                                                                                   71

