


Page 66 - rapport ommp2018
P. 66
Goods Traffic


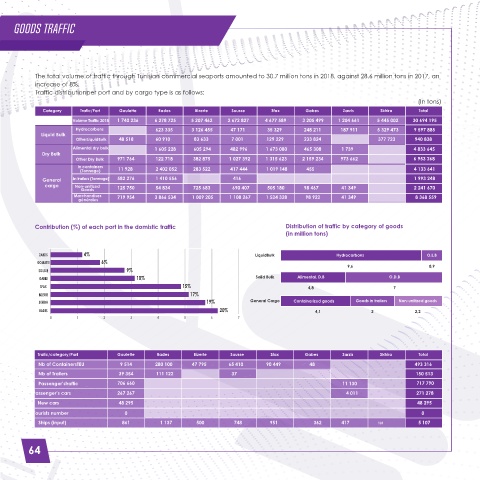
           The total volume of traffic through Tunisian commercial seaports amounted to 30.7 million tons in 2018, against 28.6 million tons in 2017, an
           increase of 8%.
           Traffic distributionper port and by cargo type is as follows:
                                                                                                                            (In tons)
              Category   Trafic/Port  Goulette  Rades      Bizerte   Sousse      Sfax      Gabes      Zarzis     Skhira      Total
                      Volume Traffic 2018  1 740 236  6 278 725  5 207 462  2 672 827  4 677 589  3 205 499  1 204 661  5 445 002  30 694 195
                       Hydrocarbons            623 335    3 126 455  47 171     35 329     248 211    187 911   5 329 473  9 597 885
             Liquid Bulk
                       OtherLiquidBulk  48 518  60 910    83 633     7 001      129 229    233 824               377 723   940 838
                       Alimental dry bulk      1 605 228  605 294    482 996    1 673 080  465 308    1 739                4 833 645
             Dry Bulk
                       Other Dry Bulk  971 764  122 718   382 875    1 027 392  1 315 623  2 159 234  973 662              6 953 268
                        In containers
                         (Tonnage)  11 928     2 402 052  283 522     417 444   1 019 148  455                             4 133 641
              General  In trailers (Tonnage)  582 276  1 410 556      416                                                  1 993 248
              cargo    Non-unitized
                         Goods      125 750    54 834     725 683     690 407   505 180    98 467     41 349               2 241 670
                       Marchandises   719 954  3 866 534  1 009 205  1 108 267  1 524 328     98 922  41 349                8 368 559
                        générales
                        générales
                        générales
           Contribution (%) of each port in the domistic traffic                     Distribution of traffic by category of goods
                                                                                     (in million tons)


             ZARZIS       4%                                                LiquidBulk              Hydrocarbons               O.L.B
            GOULETTE           6%
                                                                                                        9,6                     0,9
            SOUSSE                    9%
             GABES                       10%                                 Solid Bulk  Alimental. D.B             O.D.B
             SFAX                                      15%                                  4,8                      7
            BIZERTE                                      17%
            SKHIRA                                            19%          General Cargo  Containerized goods  Goods in trailers  Non-unitized goods
             RADES                                                20%                         4,1              2            2,2
                0       1       2       3      4       5       6       7


            Trafic/category/Port    Goulette   Rades      Bizerte    Sousse      Sfax      Gabes      Zarzis     Skhira      Total
            Nb of ContainersTEU     9 514      280 100    47 795     65 410     90 449      48                             493 316
            Nb of Trailers          39 354     111 122               37                                                     150 513
            Passenger’straffic      706 660                                                           11 130                717 790
           Passenger’s cars         267 267                                                                4 011            271 278
            New cars                48 295                                                                                  48 295
           Tourists number            0                                                                                      0
            Ships (input)            861          1 137    500        748        951             362  417        131         5 107


         64

