


Page 88 - rapport ommp2018
P. 88
PORT OF GABES

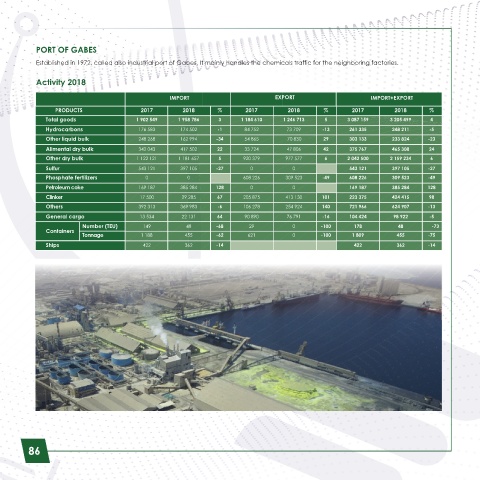
            Established in 1972, called also industrial port of Gabes, It mainly handles the chemicals traffic for the neighboring factories.

            Activity 2018


                                                   IMPORT                         EXPORT                       IMPORT+EXPORT
                 PRODUCTS                  2017        2018      %        2017        2018       %       2017         2018      %
               Total goods               1 902 549    1 958 786   3     1 184 610    1 246 713   5      3 087 159   3 205 499   4
               Hydrocarbons               176 583     174 502    -1      84 752       73 709    -13     261 335      248 211    -5
               Other liquid bulk          248 268     162 994    -34     54 865       70 830    29      303 133      233 824   -23
               Alimental dry bulk         342 043     417 502    22      33 724       47 806    42      375 767      465 308    24
               Other dry bulk            1 122 121    1 181 657   5      920 379     977 577     6      2 042 500   2 159 234   6
               Sulfur                     543 121     397 105    -27       0           0                543 121      397 105   -27
               Phosphate fertilizers        0           0                608 226     309 523    -49     608 226      309 523   -49
               Petroleum coke             169 187     385 284    128       0           0                169 187      385 284   128
               Clinker                    17 500       29 285    67      205 875     413 130    101     223 375      424 415    98
               Others                     392 313     369 983    -6      106 278     254 924    140     721 966      624 907   -13
               General cargo              13 534       22 131    64      90 890       76 791    -16     104 424      98 922     -5
                         Number (TEU)      149          48       -68       29          0        -100      178          48       -73
               Containers
                         Tonnage           1 188        455      -62      621          0        -100     1 809        455      -75
               Ships                       422          362      -14                                      422         362      -14


            Navires


         86

